Deciphering and Decoding Research
Apply the Knowledge You Have Gained from the Blog Series on Statistics and Databases in Parts 1-5.
Authors:
Kimberly Zambito, MD, Orthopaedic Surgeon and Owner of Qualis Os
www.qualisos.com
Nick Birch FRCS (Orth), Consultant Spine and Bone Health Specialist and owner of OsteoscanUK
www.osteoscanuk.com
A Step by Step Guide to Reading a Research Article
Are you ready to apply the knowledge you have gained from our 5-part series on statistics and databases in bone health? As you prepare to read this blog, please do three things:
1. Review Part 5: Understanding Relative Risk and Absolute Risk…Relatively Speaking It’s Absolutely Crazy!
2. Download, print, or have ready the article to review: FRAME Study: The Foundation Effect of Building Bone With 1 Year of Romosozumab Leads to Continued Lower Fracture Risk After Transition to Denosumab. This is in the Journal of Bone and Mineral Research (JBMR). (Journal of Bone and Mineral Research, Vol. 33, No. 7, July 2018, pp 1219–1226 DOI: 10.1002/jbmr.3427). This is a free article and can be accessed easily.
3. Roll up your sleeves and get ready to have fun as we go step-by-step on understanding a research article.
We chose this article, as many clients have asked about medications for the treatment of osteoporosis (OP). Specifically, clients want to know if they should take bone-building medication, then transition to a medication that prevents bone resorption. Recently, the medical community has recognized that the order medication is given in, which is termed “sequencing”, has an impact on bone mineral density and thereby fracture risk. The purpose of this blog is to teach you how to critically review a research paper using the knowledge you have gained about statistics, specifically Relative Risk Reduction (RRR), Absolute Risk Reduction (ARR) and the Number Needed to Treat (NNT).
FRAME was a pivotal study which supported the clinical benefit of building bone with Romosozumab before transitioning to Denosumab. Romosozumab is a monoclonal antibody that binds to and inhibits sclerostin, a molecule formed in bone that limits the ability of osteoblasts to create new bone. Sclerostin is a key component in the process of bone remodeling, and it prevents over production of bone when it is not needed. Therefore, Romosozumab increases bone formation and decreases bone resorption by blocking sclerostin's action. Think of sclerostin as an “off” switch to prevent excess bone formation. Romosozumab disables the “off” switch.
Denosumab is also a monoclonal antibody that is a very powerful inhibitor of osteoclasts. The antibody binds to RANKL, a molecule that is required to turn osteoclast precursor cells into osteoclasts. By doing so it inhibits bone resorption.
The FRAME study looked at the effect of administration of Romosozumab for 1 year, followed by Denosumab for a year. The idea behind the sequencing of these medications is to build bone with Romosozumab, then to use Denosumab to prevent resorption of the bone that was built, so locking in the treatment benefit in the longer term.
Step 1: Each research article has a title, a list of authors, the institutions of each author, and an abstract. This part is largely self-explanatory. The abstract summarizes the key points of the article and typically includes an introduction and reason for the study, the study design/methods, results, and conclusions. The abstract provides a “Cliff Notes” (“brief summary” for non-US readers) version of the article. And you know, the devil is always in the detail.
Step 2: Disclosures and Acknowledgements are typically found at the end of the article. Authors are required to inform readers of potential conflicts of interest. Funding and work done by individual authors can be found in the Acknowledgements. Disclosures and Acknowledgements for this article are found on page 1225. Note that this study was sponsored by three pharmaceutical companies, Amgen Inc, UCB Pharma and Astellas Pharma. All but one of the authors was either a paid advisor to one or more of the companies or was employed by one of the companies. Therefore, there is a notable risk of bias.
Step 3: The Introduction section of a research article provides background information to put the purpose of the study in context. The introduction section of this article reviews the drugs involved in the study, results of previous relevant studies including animal model studies and phase 3 of FRAME in which Romosozumab administered for 1-year was compared to placebo. The methodology of the FRAME study is described in a previous paper, but in summary it was a Phase 3, international, randomized, double-blind, placebo-controlled trial in 7180 postmenopausal women with osteoporosis. Half were treated with romosozumab for one year and the other half had placebo for a year. Both groups went on to have Denosumab for a year.
There is also mention of the FREEDOM study and its Extension which evaluated Denosumab alone. FREEDOM was the pivotal study for denosumab to assess its effect on fracture rates. It lasted three years and its Extension went on for a further seven years. When describing the comparison that has been made between the FRAME and FREEDOM studies, the authors state, “…changes in BMD observed with Romosozumab and then Denosumab in the context of changes seen in the FREEDOM and its Extension studies with Denosumab alone during which continued BMD gains were observed over 10 years of treatment, to qualitatively assess the magnitude of BMD changes with Romosozumab relative to the only OP treatment shown to increase BMD over an extended period.” What does this mean? The authors describe the comparison as being “qualitative” rather than “quantitative” which should sound some alarms. It is very difficult to draw firm conclusions from a qualitative comparison when the studies being compared have used quantitative measures unless it is part of a “mixed methods” analysis. If that is the case the insights and conclusions can be very helpful to understand a particular research topic. However, the authors of the current study did not used mixed methods. So, let’s now dive into the methods of this study and see how they performed their analysis.
Step 4: The Methods section describes the nuts and bolts of the study. The methods should be descriptive enough to replicate a study. The Methods section of this article includes the study design, outcome measures, and statistical analysis. The first sentence of this section states, “This secondary, post-hoc analysis was based on FRAME, a phase 3, international, randomized, double-blind, placebo-controlled, parallel-group trial…” Let's decode this sentence.
- Secondary post-hoc means a statistical analysis was performed on a study once it has concluded. The results of the initial study may have shown there were some differences between groups but did not specify what the differences were, or which groups were different. A post-hoc study helps to tease out the differences between groups.
- Phase 3 refers to a stage of clinical trial. Phase 3 trials evaluate the effectiveness and safety of a new treatment compared to a standard treatment or placebo.
- Randomized means participants and researchers did not assign a participant to a group.
- Double-blind means that neither the participant nor the research know what treatment (placebo or drug) was given to each participant.
- Placebo-controlled means one group receives a placebo (no treatment) while the other group receives treatment (drug being studied)
- Parallel group is a type of clinical trial design. Participants are randomly assigned to one a group, each group receives a different intervention. Participants are in their assigned group for the duration of the trial.
The methods describe the inclusion and exclusion criteria, how the study was conducted, and the endpoints for the study. The main, or “co-primary”, endpoints for this study were the incidence of new vertebral fractures through month 12 and through month 24. Secondary endpoints were other fracture types. Data collection included BMD measured by DXA at the lumbar spine and total hip at various time intervals. The analysis also used BMD data from FREEDOM and its extension.
All research articles should have a statement regarding the ethical treatment of participants and approval by an ethics committee or institutional review board. Also mentioned in the methods are what will be measured, or intended endpoints.
Outcome measures are specific and quantifiable metrics that can be used to determine if treatment was effective. The outcome measures for this study were:
- Percent change from baseline in BMD by DXA of varying magnitudes; chosen empirically with 3% representing the approximate least significant change (LSC). Comment from the peanut gallery about this 3% LSC. We know from previous blog posts that the commonly accepted LSC for DXA is approximately 5%. Why was 3% used in this study?
- Mean absolute change from baseline in lumbar spine and total hip BMD T-scores (read the additional details in the article) …the authors are comparing 1 year of Romosozumab followed by 1 year of Denosumab (FRAME) to 10 years of Denosumab (FREEDOM). Hold on now…when we evaluate changes in BMD, don’t we use the actual BMD in g/cm2 and not T-score? If you recall, a T-score represents a range of values. Maybe T-scores were used because a change in T-score might mean a change in diagnosis classification.
- Subject incidence of fractures in the second year of FRAME.
The Statistical analysis section describes how the authors evaluated the data collected during the study. Statistics help researchers determine whether or not a treatment produced the desired effect. To assess BMD T-score changes, treatment groups in FRAME (Romosozumab + Denosumab v placebo + Denosumab) were compared to those in FREEDOM (Denosumab alone). A couple of questions asked by the researchers were:
- Does one year of treatment with Romosozumab followed by a year of Denosumab increase BMD T-score and decrease fracture rates when compared to placebo (no medication)?
- Does one year of Romosozumab followed by a year of Denosumab increase BMD T-score and decrease the incidence of fractures when compared to those who took 10 years of Denosumab?
Step 5: The Results section describes…the results! Results in this article are subdivided into Subject disposition, BMD responder analysis, BMD T-score changes, and FRAME and FREEDOM T-score changes. There were 7180 participants in the FRAME study divided into two groups. Group characteristics were similar. There were 7808 participants in the FREEDOM study, also divided into two groups. However, for the comparison to be valid, the two large groups of participants should have had similar baseline characteristics i.e. gender, ethnicity, height, weight etc. but this was not actually be the case. The FRAME participants were slightly younger by on average 1.4 years. However, the authors did not provide details of the statistics of that difference which means even a 1.4 year mean difference in such large cohorts might make them unequal. The geographical locations from where participants were recruited were also different. This difference is important as it means the results of the FRAME study might not reflect the main target population for the drugs i.e. North America, Western Europe and Australia and New Zealand. However, the FREEDOM study was more representative. There was quite a large difference between the studies in the numbers of participants with pre-existing (prevalent) vertebral fractures and a history of non-vertebral fractures. Vertebral fractures were almost 30% more common in the FREEDOM participants compared to those in the FRAME study and non-vertebral fractures almost twice as common. The fracture rate is important when considering the bone mineral density. The average T-scores for the lumbar spine were similar across the two studies, but for total hip and femoral neck they were much lower in the FRAME participants. Average hip T-scores in the FREEDOM participants, for total hip and neck of femur, indicated a majority with osteopenia, while for the FRAME participants the majority had osteoporosis. Therefore, the FREEDOM trial participants had a much higher fracture rate with better T-scores at the hip compared to the FRAME trial volunteers. This is further reflected in the average FRAX scores for Major Osteoporotic Fractures that were close to the low-risk range for FRAME triallists (10.9%) but in the high/intermediate range (16.3%) for FREEDOM participants. As both trials used change in bone mineral density as primary outcomes, the difference in fracture rate, bone density and risk stratification between the two groups might be important.
The table below summarizes the percentage of participants who experienced a >3%, >6%, and >10% BMD gain in the FRAME study.
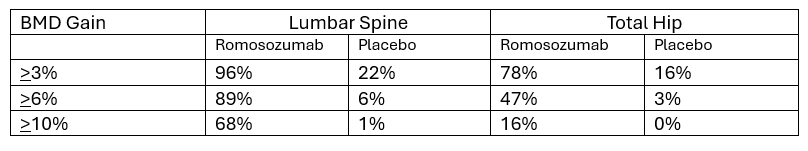
In each group there were participants who did not gain BMD and those who lost BMD. When reading the details, you may notice that of the participants who received placebo, 47% did not increase BMD at the lumbar spine, and 15.6% had a decline of 3% or more. Let’s ponder this for a moment. Yes…Romosozumab increases BMD more than placebo.
- Yet it is not impossible to increase BMD while not taking a drug for osteoporosis.
- Of the 47% who did not increase in BMD in the placebo group, was their BMD stable? Consider that 15.6% had a decline in 3% or more.
- If you recall, the authors stated the LSC for this study was set at 3%. Commonly accepted LSC for DXA is 5%. Why did the authors use an LSC of 3%? Perhaps making a statement that 96% of participants increase BMD by 3% is more impressive than 89% increasing by 6%. Knowing that commonly accepted LSC for DXA is 5%, one may ask if the change in BMD seen in this study real? Mathematics gymnastics!
Apply the same mathematics gymnastics to the total hip data.
Let’s look at Figure 3 on page 1224. Are you ready to apply your knowledge of Absolute Risk and Relative Risk? Look at graph labelled “A” in the upper left corner of the figure. This graph is titled, “New Vertebral Fractures”. Let’s focus on the Year-by-Year subheadings.
Through Year 1
The RRR was 73%. This means there was a 73% relative risk reduction for new vertebral fracture for participants on Romosozumab. How was this calculated? The numerical values are below the words “New Vertebral Fractures”.
Relative Risk Reduction is calculated as follows:
(Control Group – Experimental Group) divided by the Control Group
59/3322 in the placebo group (approx. 1.8%) and 16/3321 in the treatment group (approx. 0.5%)
1.8% - 0.5% = 1.3%
Divide 1.3% by 1.8% = 72%
Note the article reads 73% which may be the result of using calculated values rather than rounding to the nearest whole integer.
Relative Risk compares the risk of a certain event occurring in two groups. It tells you how much more (or less) likely the event is in one group compared to another. Relative Risk is 0.5%/1.8% = 0.277. Recall if RR <1 then risk of fracture has been reduced. If RR is >1, then the risk of fracture has not been reduced.
Based on this Relative Risk, Romosozumab has reduced the risk of new vertebral fractures when compared to placebo.
Absolute Risk Reduction is not discussed in most research articles. Absolute Risk Reduction (ARR) is the risk of something happening minus something happening with an intervention. Absolute Risk Reduction can be calculated as the difference between 0.5% and 1.8% which is 1.3% decrease in New Vertebral Fractures for those taking Romosozumab for 1 year. Which number is more impressive - Relative Risk Reduction or Absolute Risk Reduction? Why is Absolute Risk Reduction not included in the results?
Let’s practice again and focus on Figure 3, graph A, “Year 2 alone”. This graph compares incidence of new vertebral fractures in those who had Romosozumab followed by Denosumab to those who had Denosumab alone. Relative Risk Reduction is included in the image. What is the ARR for Year 2 and Year 2 Alone?
Year 2 ARR is 2.5% - 0.6% = 1.9%
Year 2 Alone ARR is 0.9% - 0.2% = 0.7%
Let’s reframe the results for New Vertebral Fractures based on RRR and ARR.
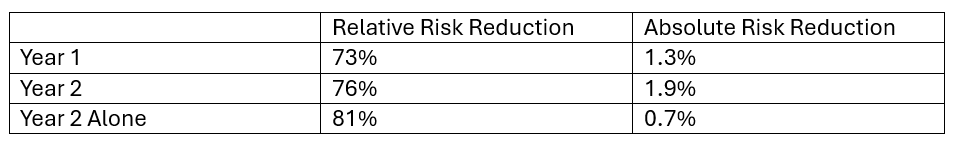
In Year 1 participants had either placebo or Romosozumab. RRR is 73%. Recall, RRR shows how much the risk changes proportionally between the two groups. Much more impressive than ARR of 1.3%. Recall, absolute risk is the risk of something happening minus something happening with an intervention.
In Year 2 participants had Denosumab having had a year of either placebo or Romosozumab. The RRR is 76%, showing how much the risk changes proportionally between the two groups. The ARR is 1.9%. These numbers tell us that taking Romosozumab followed by Denosumab versus placebo followed by Denosumab decreased incidence of new vertebral fracture by 1.9%, but proportionally by 76%.
In Year 2 Alone investigators compared incidence of new vertebral fractures between those who had Denosumab alone to those who had Romosozumab followed by Denosumab…why? Because an RRR value of 81% is even better than 73%! Holy cow…sequencing medications produces even more impressive results! The ARR was 0.7%...not very impressive. What does this tell us about sequencing these medications? Patients who take Romosozumab followed by Denosumab decrease fracture risk by 0.7%!!! Whoa!!! But proportionally, new vertebral fracture incidence is decreased by 81%.
Let’s look at hip fractures in the same figure, graph D. You do the calculations and check your answers on the table below.
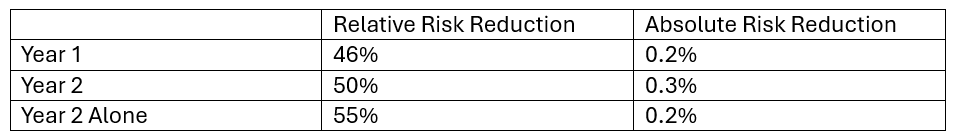
Take a moment to interpret these numbers knowing the definitions of RRR and ARR. What do the numbers tell you about hip fracture reduction in those who had placebo versus Romosozumab; those who had placebo followed by Denosumab versus those who had Romosozumab followed by Denosumab; and those who had Denosumab versus those who had Romosozumab followed by Denosumab?
Next, we can calculate the Number Needed to Treat (NNT) to prevent a fracture. The data that allows this analysis is found in a supplementary data file which includes Supporting Tables 1 and 2. In many journals access to supporting data is via a hyperlink in the text, but not on this occasion and to access this data, you have to know where to look on the journal webpage.
To save you the bother, here is the table with some notable additions:
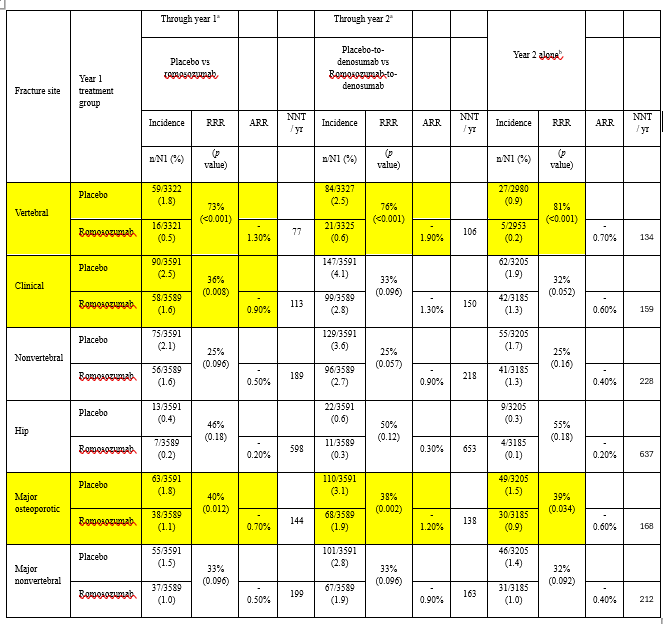
We have highlighted in yellow results that show statistically significant differences. You will see that most results did not reach statistical significance. Also, we have added the NNT values for each comparison.
To calculate the NNT per year take the difference in the number of fractures that occurred in the two arms and divide the number of participants in the treatment arm by that number (or take the reciprocal of the ARR).
Here is a summary of the results:
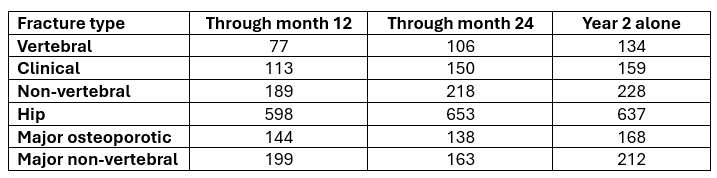
To prevent one new hip fracture in the first year when participants were treated with Romosozumab, 598 needed to take the drug. In the second year, when Denosumab was the treatment, 637 needed to have the injections. Wow!
Let’s wipe the sweat from our brows and move onward from the results.
Step 6: The Discussion section is an opportunity for the authors to summarize the results of the study, reflect on its strengths and weaknesses and to offer direction for future research. The authors summarized the results of this study, as well as, preclinical trials in ovariectomized monkeys with increased bone mass and strength; and improvements in cortical thickness and estimated bone strength using CT and finite element analysis in post-menopausal women. Based on this study and the prior studies, the authors support sequential therapy using Romosozumab followed by Denosumab.
The authors reviewed the strengths and weaknesses of the study. The greatest strength of the study was large sample size, complete data on all study endpoints, and quality control of all BMD measures. However, if you dig deeper in the article in the methods section, you will find that BMD was measured at different intervals in Argentina. Also, in the Statistical analysis subsection “missing BMD values were imputed by carrying forward the last post baseline observation”. This means that if a result was missing, it was estimated from the previous result in the same patient. This is a well-validated method, but it does rely on the test being accurate.
How were BMD measurements quality controlled? It is well established that DXA scans can show significant errors unless they are performed with strict quality controls. There is nothing in the current paper to show that the level of quality was checked, which means the BMD results might not be as accurate as the authors would like to believe. Perhaps this information is described in another article?
Limitations of the study included the post-hoc nature (looking back in a rearview mirror), and “overall low fracture rates in the study limiting the power to detect between-group differences”. Furthermore, the authors recognized that they were not able to “perform quantitative correlation between BMD attained and fracture rates in the FRAME study because of the low rates of fracture events in the study…” Then they double down stating that “previous studies have shown that BMD attained on therapy correlates with fracture rate” and cite one study in the superscript reference number 38 which is an article from the FREEDOM study.
Step 7: The Conclusion section summarizes the authors take away message from the study. The authors noted large improvements in BMD in participants taking Romosozumab. The authors felt their data supported the potential clinical benefit of sequential treatment of Romosozumab followed by Denosumab. Based on your review of this article, do you agree with the authors? Reflect on your knowledge of Relative Risk Reduction, Absolute Risk Reduction and Number Needed to Treat. Is there enough reduction in fracture risk that you can make a decision that is best for you? Do you take the medication or not?
Step 8: Thinking practically and realistically.
Patent expiration: Both Romosozumab and Denosumab are made by a single pharmaceutical company. The Denosumab patent in the US expires in 2025, and in Europe in 2026. The Romosozumab patent in the US and Europe expires around 2035. Once the patent expires on any medication, then generic brands are made available and its time to bring to market the next big medication.
Cost of medications: This is a major concern for many patients, especially those on fixed incomes. Some pharmaceutical companies have programs for discounts, but let’s look at the average cost for these medications.
The average cost for Romosozumab is $2,628.92/month in the US, if a patient has insurance. If there is no insurance, the average retail price is $3,294.56. The annual cost if a patient has insurance is $31,547.04 in US dollars.
Denosumab on average costs $1,875.43 per injection. Injections are given every 6 months. If a person has no insurance, the retail price ranges from $1500-$2000. The annual cost if a patient has insurance is $3,750.86 in the US.
If a patient undergoes sequential treatment as described in the study, then cost is estimated at $31,547.04 + $3750.86 = $35,297.90. This is for just 2 years of treatment. However, patients are often told they will need to remain on Denosumab for the remainder of their lives or go onto a bisphosphonate.
Both medications are administered in a physician’s office. The cost listed above does not include the physician office visit. Although reimbursement for an office visit for an injection is not enough to buy lunch and definitely not enough for a physician to pay the office overhead.
These calculations and statements are designed to illustrate the cost of treatment for osteoporosis and should be taken as estimates. You may consider comparing this to a cost of care for a fracture.
We hope the information in this blog has empowered you with knowledge to make decisions that are right for you. Keep in mind that these medications have been beneficial for many people. We encourage you to optimize the things you can optimize on your bone health journey - building good nutritional habits, maintaining muscle mass, working on balance and falls prevention, choosing a positive mindset and being present in the moment. Those are the things medication cannot do for you. The power resides in you.
Don’t forget – you are not just a T-score! You are an entire beautiful and wonderful YOU!