Part 5: Understanding Relative Risk and Absolute Risk…Relatively Speaking, It’s Absolutely Crazy!


A Little Knowledge Lights The Way

Authors:


Kimberly Zambito, MD, Orthopaedic Surgeon and Owner of Qualis Os
www.qualisos.com


Nick Birch FRCS (Orth), Consultant Spine and Bone Health Specialist and owner of OsteoscanUK
www.osteoscanuk.com


Welcome to Part 5 in our series of databases and statistics. In keeping with the Star Wars theme from Part 4 (the fourth is with you). You are about to enter the final stage of Jedi training. Please review Part 4 before beginning Part 5.


Having discussed relative risk as a ratio in comparison to the odds ratio in Part 4, we now need to turn to the very heart of this matter: What are Absolute and Relative Risks and how are they important in judging whether treatment is effective?


Absolute and Relative Risk


Like risk and odds, absolute and relative risk sound similar but are not the same. To begin with we should define the terms:


Absolute Risk (AR) is the actual probability or chance of an event occurring in any defined population over a specific time period. It tells you how likely an outcome is and can be thought of as the baseline likelihood.


Relative Risk (RR) compares the risk of a certain event occurring in two groups. It tells you how much more (or less) likely the event is in one group compared to another. It is therefore the proportional difference between groups. We have already seen one example in Part 4 of our series.


Here are five medical examples that demonstrate the difference between absolute and relative risk.


Heart Disease and Statins

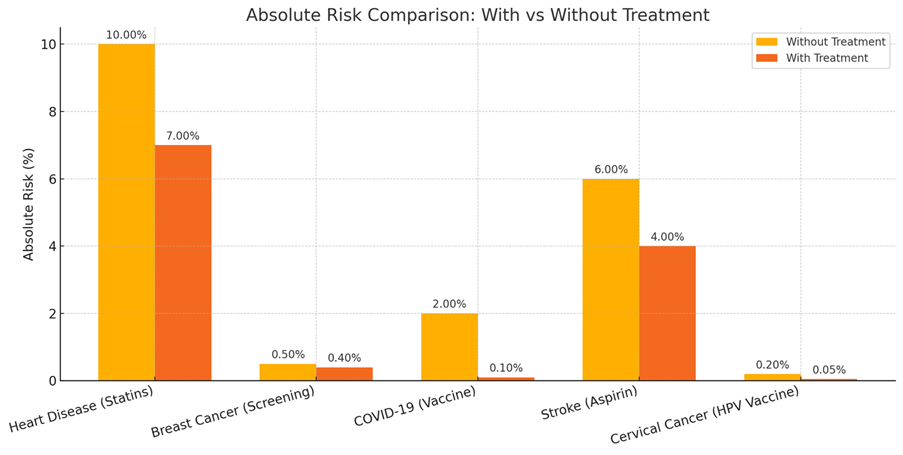
The 10-year risk of a heart attack for a group of individuals could be 10% without statins. With statins the risk might drop to 7%. This represents an absolute risk reduction of heart attacks of 3% but a relative risk reduction of 30%.


Breast Cancer Screening

Without screening, 5 in 1,000 women die of breast cancer over 10 years. With screening, 4 in 1,000 die. The absolute risk reduction is 0.1% (1 in 1000), but the relative risk reduction is 20% (1 fewer death per 5).


Covid-19 Vaccine

In unvaccinated people, the risk of hospitalization might be 2%. In vaccinated people it may be 0.1%. The absolute risk reduction is 1.9%, but the relative risk reduction is 95%.


Aspirin for Stroke Prevention

In high-risk patients, the stroke rate could be 6% without aspirin, but with aspirin 4%. This represents an absolute risk reduction of 2%, but a relative risk reduction of 33%.


HPV vaccination to prevent cervical cancer

The cervical cancer risk in unvaccinated women may be 0.2%. In vaccinated women it could fall to 0.05%. The absolute risk reduction is therefore 0.15% and the relative risk reduction is 75%.


Here’s a chart showing the absolute risk for each medical scenario, comparing outcomes with and without treatment or intervention. This helps illustrate the actual risk reduction patients might experience.


The distinction between absolute risk and relative risk is really important when reviewing research on a clinical trial of an intervention as we want to understand if the intervention is clinically relevant. For example, will taking a medication decrease risk of fracture? Let’s return to Arizona and the Grand Canyon adventures.


In our example (from Part 4), the risk of sustaining a hip fracture while on an adventure in the Grand Canyon is 22.5%. Now, let’s make a change so all participants no matter the chosen adventure are wrapped in bubble wrap. Wrapping participants in bubble wrap decreases the risk of sustaining a hip fracture to 10%. 


The absolute risk reduction (ARR) is the risk of something happening minus something happening with an intervention. In this example, ARR is   22.5% - 10%, or 12.5%. This means that if a participant does 100 adventures, 12.5 hip fractures will be prevented by using bubble wrap. Another way to think about it, a participant would have to be wrapped in bubble wrap 12.5 times to prevent 1 hip fracture while doing an adventure in the Grand Canyon. This is referred to as Number Needed to Treat (NNT) which we’ll come back to below. ARR is interpreted in the context of baseline risk. 


Relative Risk Reduction is the probability of something happening in one group compared to another group. RRR is an estimate of the percentage risk that is removed because of a new intervention. For example, we have 100 people with flabby muscles. Fifty of these people get treated with a new drug called “pump-you-up” and 1 person falls and sustains a hip fracture. The risk of hip fracture in this group is 1/50, or 2%. The other 50 people do not get the new drug and 2 people fall and sustain a hip fracture. The risk of hip fracture in this group is 2/50, or 4%. In this example, the relative risk is 2%/4%, or 0.5. 


If you recall, if RR <1, then risk has been reduced. If RR equals 1, then risk has not changed. If RR >1, then risk has increased.


Things are going to get tricky now. Relative Risk Reduction (RRR) shows how much the risk changes proportionally between the two groups. In our example, the group that received “pump you up” sustained a hip fracture 50% less often than the group that did not receive “pump you up”. Advertising for “pump you up” may state “pump you up” decreased hip fracture by 50%. Sounds great!


Not so fast…the Absolute Risk Reduction (ARR) is the difference between 2% and 4%. ARR is 2%, meaning use of “pump you up” decreases hip fracture risk by 2%. 


Which one of these seems more impressive- RRR or ARR? Many pharmaceutical companies advertise RRR. You are more likely to want to take “pump you up” to prevent hip fractures if risk decreases by 50% rather than 2%. Each is mathematically correct, but RRR seems better than ARR.


Absolute risk gives us perspective on how much benefit a patient is likely to have from a particular treatment or intervention. Relative risk help identify disparities in outcomes. Medical professionals may overestimate the efficacy of a treatment when results are framed in relative risk, rather than absolute risk. ARR considers baseline risk and is a more useful measure than RRR to express efficacy of a particular treatment.


Let’s go back to Number Needed to Treat (NNT) as this reflects the real world of medical treatment. NNT is the number of people who need to receive a treatment for one person to benefit (e.g., avoid an event such as a heart attack or death).


The formula to calculate NNT is:  NNT = 1 / Absolute risk reduction (ARR)


Where: ARR = Absolute Risk (control group) − Absolute Risk (treatment group)


So NNT is based on absolute risk, not relative risk. Even if relative risk reduction sounds impressive (e.g. 50% for “pump you up”), the NNT could be high if the baseline (absolute) risk is low.


Low absolute risk = higher NNT (less efficient treatment)


High absolute risk = lower NNT (more efficient treatment)


NNT is a very patient-centric measure and is one of the best ways to look at a treatment if you want to know whether it is likely to benefit you. 


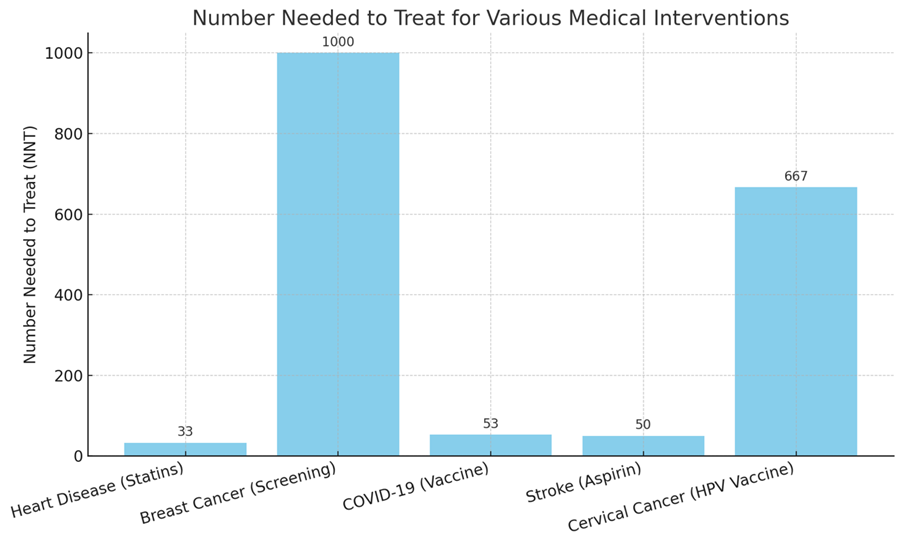
Returning to the five medical examples we looked at earlier, the NNTs are:


Condition                                         Absolute Risk Reduction (ARR)                                  NNT

Heart Disease (Statins)                                           3.0%                                                                 33

Breast Cancer (Screening)                                     0.1%                                                               1000

COVID-19 (Vaccine)                                                   1.9%                                                                 53

Stroke (Aspirin)                                                          2.0%                                                                50

Cervical Cancer (HPV Vaccine)                              0.15%                                                             667


A lower NNT means the treatment is more effective in preventing one adverse event. A higher NNT still might be acceptable if the intervention is low-risk, low-cost, or applied to large populations, such as breast cancer screening.


Here’s a chart showing the Number Needed to Treat (NNT) for each medical example. Lower bars indicate more effective interventions in terms of how many people need to be treated to prevent one adverse outcome.


NNT and Bone Health

Both Hormone Replacement Therapy (HRT) and bisphosphonates are employed to reduce fracture risk in postmenopausal women, but their effectiveness varies based on individual risk factors and the type of fracture.


Hormone Replacement Therapy (HRT) at or after menopause

HRT replaces a woman’s natural estrogen that is lost when the ovaries stop producing the hormone at the time of menopause which on average is around the age of 50. It is well-established that bone mass reduces as a result of menopause and the risk of fragility fractures increases.

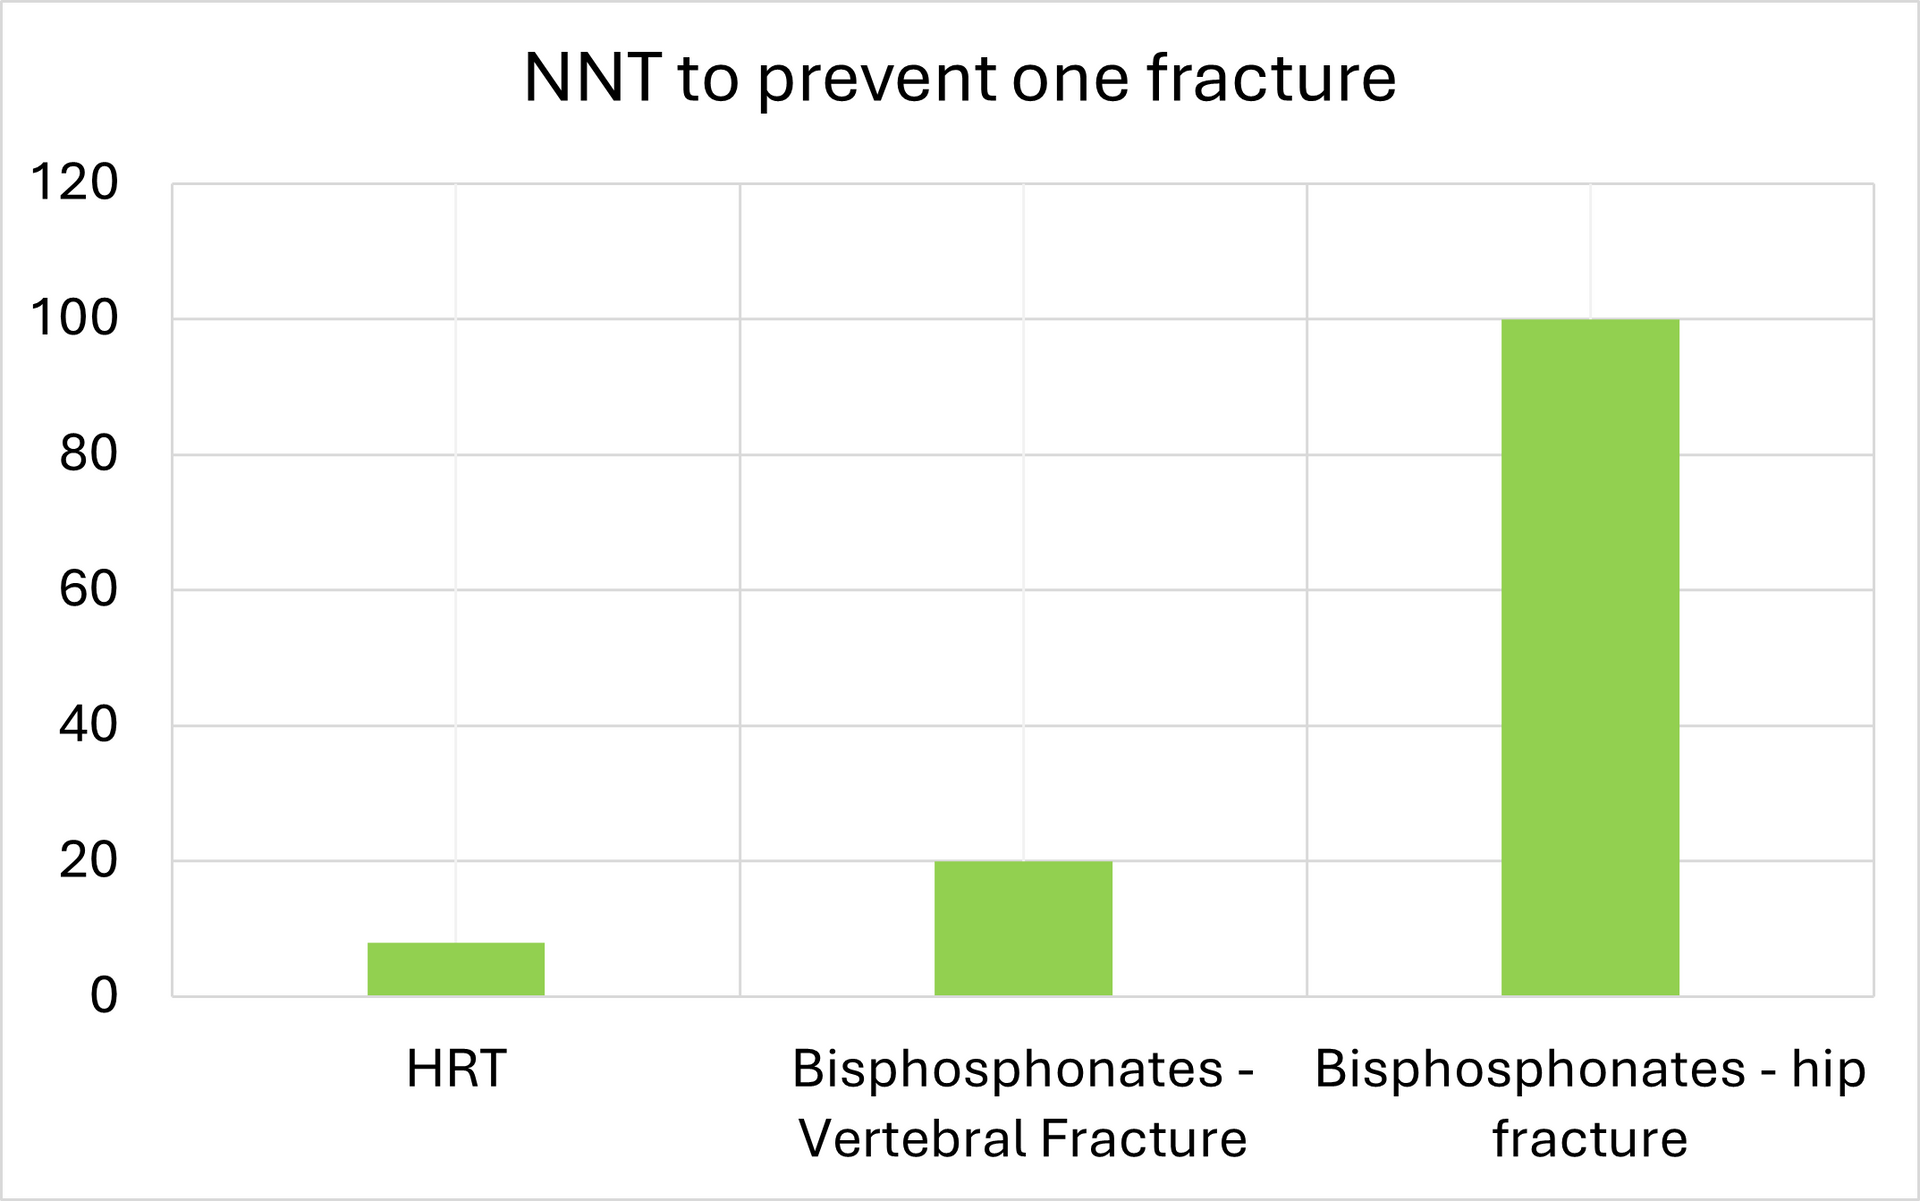
NNT: Approximately 8 postmenopausal women need to undergo HRT to prevent one fracture. 


Bisphosphonates

Bisphosphonates are a class of drugs that prevent the loss of bone density but do little to improve bone toughness. Their effectiveness in fracture prevention varies:

Vertebral Fractures: NNT: Approximately 20 women need to be treated to prevent one vertebral fracture. 

Hip Fractures: NNT: Approximately 100 women need to be treated to prevent one hip fracture. 


Here is a chart showing the difference between the NNT to prevent one fracture if a woman uses HRT or bisphosphonates:


Anabolic agents

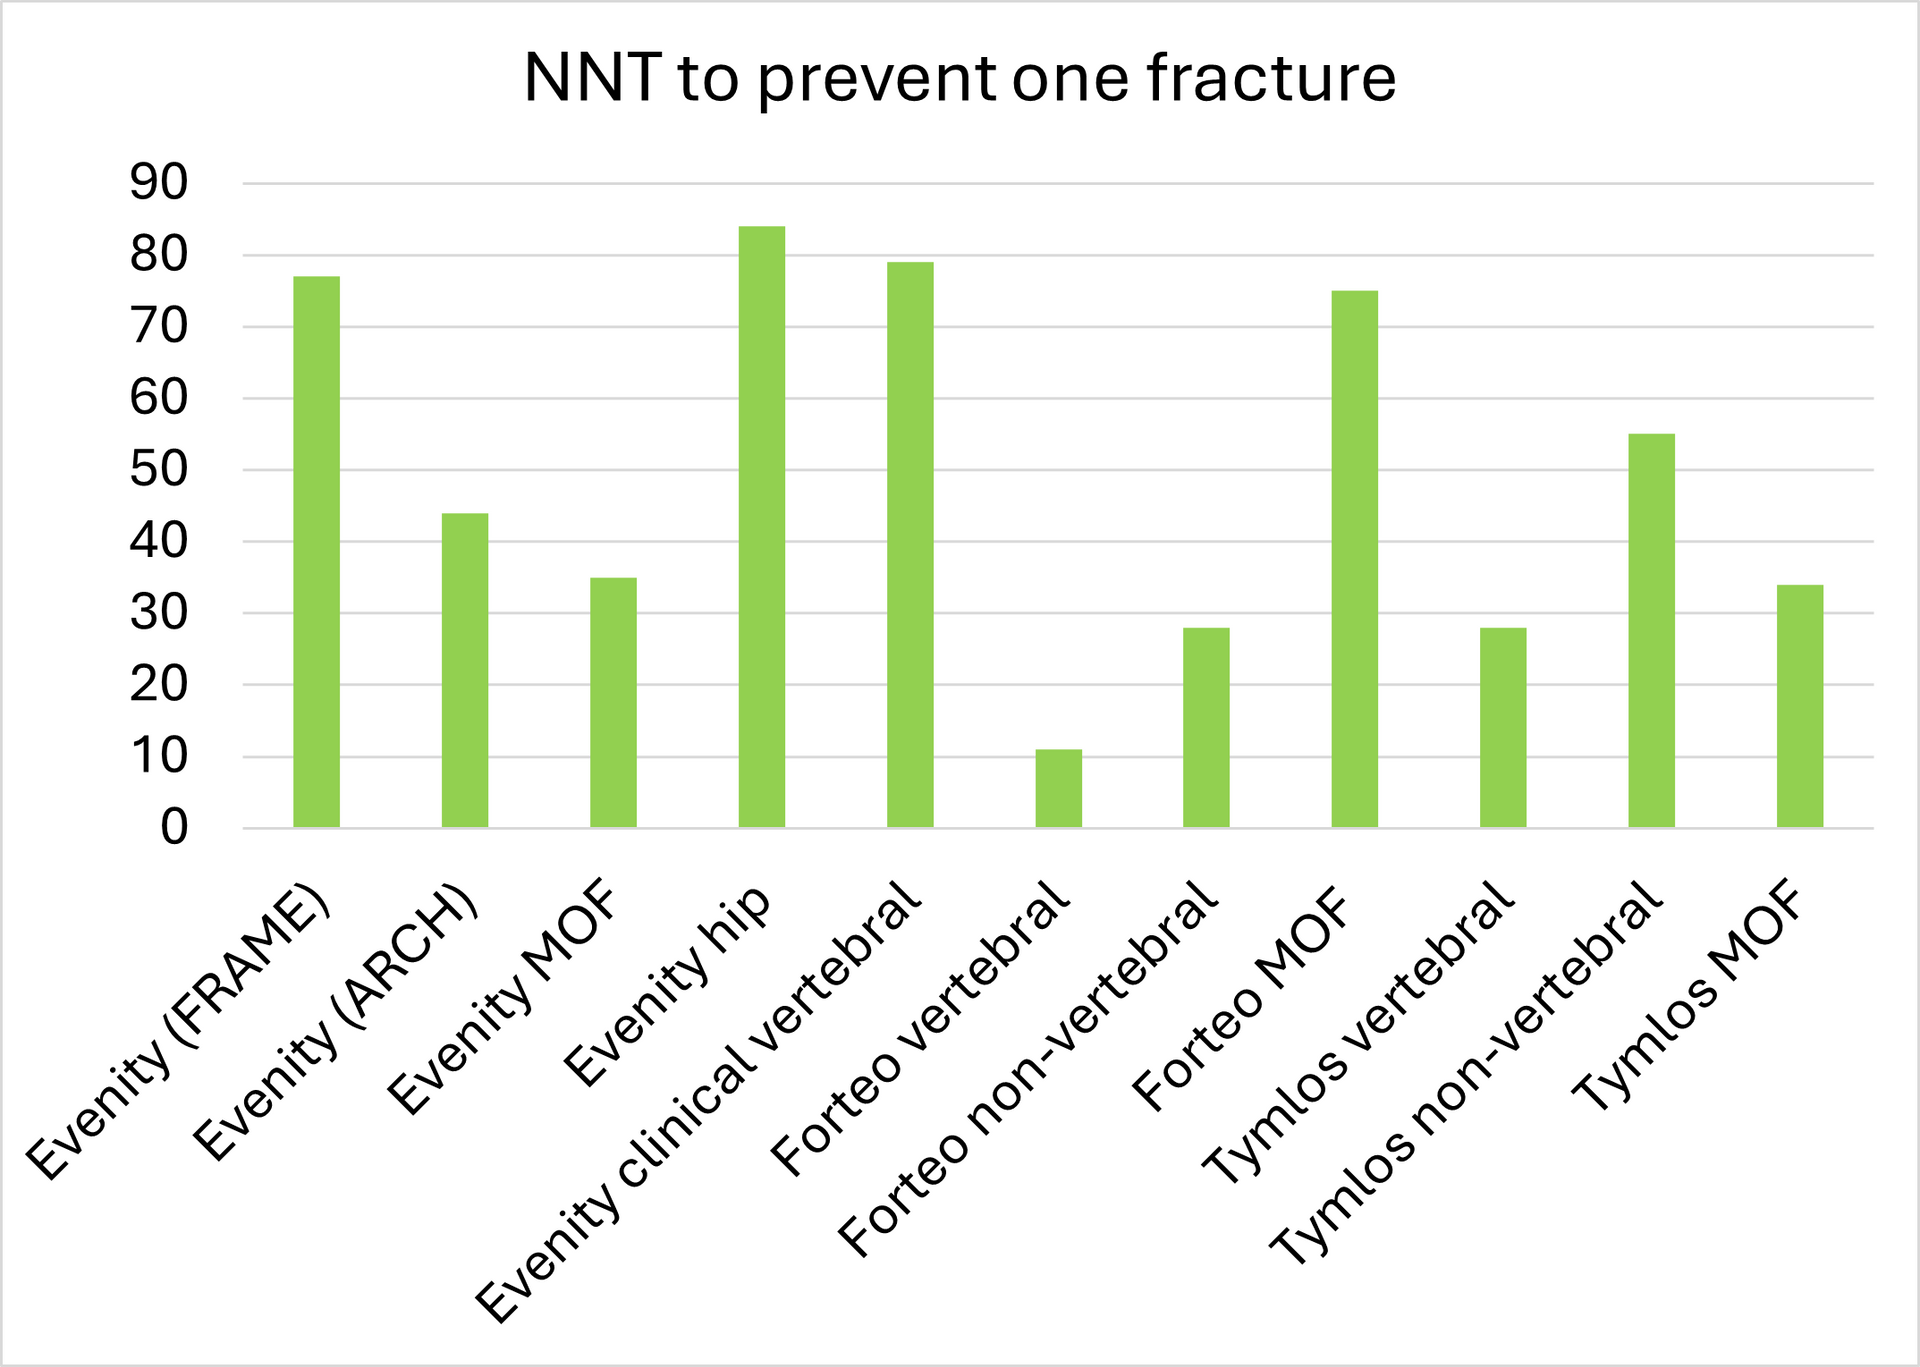
The bone building drugs (“anabolic” agents) increase bone density and bone toughness. The three in common use are: Romosozumab (Evenity), Teriparatide (Forteo) and Abaloparatide (Tymlos).


Treatment                                                   Fracture Type                            NNT (Approximate) / Comparator

Romosozumab                                            Vertebral (FRAME trial)             77              Placebo

                                                                         Vertebral (ARCH trial)                44             Alendronate

                                                                         Major osteoporotic (MOF)        35              Alendronate

                                                                         Hip                                                  84             Alendronate

                                                                         Clinical vertebral                         79             Alendronate

Teriparatide                                                  Vertebral                                        11               Placebo

                                                                         Non-vertebral                               28            Placebo

                                                                         Major osteoporotic                     75             Placebo

Abaloparatide                                              Vertebral                                        28             Placebo

                                                                         Non-vertebral                               55             Placebo

                                                                         Major osteoporotic                      34            Placebo


Here is a graphical representation of these numbers:


We hope you have enjoyed our series on databases and statistics. We did our best to keep each blog fun and educational.


Remember the wise words of Yoda, “A dark place we find ourselves, and a little more knowledge lights our way.” Allow the knowledge you have gained to illuminate your path forward on your bone health journey.


Remember, you are more than your T-Score. You are an entire wonderful you!

May 30, 2025
Authors: Kimberly Zambito, MD, Orthopaedic Surgeon and Owner of Qualis Os www.qualisos.com Nick Birch FRCS (Orth), Consultant Spine and Bone Health Specialist and owner of OsteoscanUK www.osteoscanuk.com Do you remember the scene: Alec Guiness as Obi One Kenobi in the bar on Tatooine telling the inquisitive Imperial war troopers that “there is nothing to see here. Move on.” He was using a Jedi Mind trick. Have you ever wondered about the use of similar Jedi mind tricks in medical research? Seriously, statistics can seem like Jedi mind tricks depending on how numbers are presented or manipulated. Many of our clients and blog readers have requested information about understanding “risk” as it pertains to results in research studies. In keeping with the Star Wars theme, the Force is Strong with our readers. Thank you for the inspiration. Risk and Odds “Risk” is the likelihood of something “bad” happening or a loss resulting from a particular action, decision, event, or situation. It involves uncertainty about the future and can apply to various areas such as finance, safety, business, and for readers of this blog, bone health. There are three key aspects to risk : Likelihood (Probability): How likely it is that an event will occur? Impact (Consequence): How severe is the outcome likely to be if it did occur? Exposure: What is the extent to which someone or something is vulnerable to that risk? An everyday example of each is: In finance, how likely am I to lose money if I invest in a risky venture? What will the impact be on my family and me if I lose all my savings and get into a lot of debt? Am I particularly exposed to the risk of financial ruin because I don’t know enough about stock markets or have been misinformed about a particular investment? The term “odds” is often used instead of “risk” e.g. “Doctor, what are the odds that I will break my hip if I trip and fall?” However, “Odds” refer to the probability of an event occurring versus the probability of an event not occurring. It is not the same as risk. A bone health example would be: Odds = Hip fracture occurs versus Hip fracture does not occur Using the same scenario, an example of risk might be: Risk = Chance of hip fracture versus All possible outcomes (no fracture, fracture anywhere, death) Let’s look at a hypothetical example of a randomized controlled trial of hip fractures during adventure trips in the Grand Canyon, specifically, hip fractures sustained while tightrope walking across the Grand Canyon versus bungee jumping from a hot air balloon in the Grand Canyon.
Two doctors are looking at an x-ray of a knee on a laptop.
April 28, 2025
Authors: Kimberly Zambito, MD, Orthopaedic Surgeon and Owner of Qualis Os www.qualisos.com Dr Nick Birch FRCS (Orth), Consultant Spine and Bone Health Specialist www.osteoscanuk.com Andrew Bush, MD, Orthopaedic Surgeon www.centralcarolinaortho.com For decades doctors have known that fracture rates increase as people get older, the primary reason being impaired bone density and bone toughness. As a result, in the 1990s there was a big push to develop screening tools to predict future fracture risk and allow earlier intervention to prevent fractures if a person’s risk was high. Many methods have been developed over the years including FRAX, Q-Fracture, the Osteoporosis Self-Assessment Tool (OST), DXA T- and Z-scores, and more recently REMS T-scores, Z-scores and Fragility Scores. The simplest of these tools is the OST which uses a formula based on gender, age and weight to estimate whether a person has osteoporosis and by inference, whether their fracture risk is elevated. By definition this tool is age dependent. However, it turns out not to be particularly helpful in predicting future fracture risk as osteoporosis by itself only accounts for about a third of fragility (low trauma) fractures. A more complicated prediction tool is FRAX which was originally developed in Sheffield, England in the 1990s. It was later adopted by the World Health Organisation as their official fracture prediction device, and it is now the most commonly used screening tool for fragility fracture risk. FRAX works by comparing a person’s characteristics to information about fracture rates in a very large database that matches their age, weight, gender, country of origin and a variety of clinical features. The fracture data from the database was recorded when FRAX was developed and from this matching process a risk profile is generated. Importantly, that data has not been updated in the years since it was first collected and given the change in lifestyles and wellness characteristics that have emerged since the 1990s, it is no longer certain that the matching process used by FRAX is accurate in relation to the current population and FRAX may now be systematically over-estimating future fracture risk. The clinical risk factors (CRF) in FRAX include a past history of a fracture, history of a parental hip fracture, current use of steroid medication, current smoking and / or heavy drinking plus whether a person has a range of other medical conditions that might lead to impaired bone health e.g. malabsorption in the gut, thyroid disease, long-term liver or kidney disease, diabetes and rheumatoid arthritis. Each CRF adds a certain level of risk to the estimate of how likely a future fracture is. So, a person would reasonably expect to have a low FRAX risk if they remain healthy and active even in to their 70s and 80s. Not so! It turns out that FRAX is highly age dependent which means that however healthy you are, your risk when using FRAX to estimate fracture risk inexorably increases as you age. Initially, FRAX was derived to determine fracture risk without input from diagnostic densitometry (DXA). Subsequently, an algorithm was developed that allowed DXA-derived BMD values, or T-scores, for the hip to be included in the fracture risk estimate (REMS-derived BMD values cannot currently be used in FRAX calculations). This goes some way to improve the estimate as it uses real data from the person being assessed rather than just comparing that person to broad categories of physiological features. Trabecular Bone Score (TBS) is a DXA method that was developed to estimate bone toughness in the spine and TBS values can now be included in FRAX as well. The addition of these values increases the accuracy of fracture risk prediction via FRAX, but the age bias remains. This blog focuses on how increasing age affects FRAX generated fracture risk, irrespective of how healthy you are, and how this might lead to medical decision-making that might not make much sense. Let’s explore the use of FRAX in prediction of fragility fracture risk. FRAX can be found on the internet at https://frax.shef.ac.uk/FRAX/ .
A group of women are sitting on yoga mats in a room.
March 24, 2025
I’m Active, Eat Right, and Have Never Broken a Bone…Why is my Fragility Score Yellow or Red?!?!?!
A person is standing on a scale surrounded by fruits and vegetables.
March 17, 2025
I’m Active, Eat Right, and Have Never Broken a Bone…Why is my Fragility Score Yellow or Red?!?!?!
A group of older women are dancing together in a room.
September 23, 2024
Fall Prevention Week is September 23-27, 2024 . It coincides with the beginning of Autumn or Fall…how very punny. Falls are not funny though. Whenever a patient tells me they had a “bad” fall from a standing height, it sometimes indicates that they are in denial of their bone health. There are no “bad” falls from a standing height. There are falls that break bones and falls that do not break bones. Most of the resources on this website focus on technology to measure bone density and bone quality. While both components of bone are related to fracture risk, we cannot forget the importance of fall prevention. This blog post is not about high-impact injuries that result in broken bones, it is about preventing fractures resulting from a fall from a standing or sitting position. Why are these low energy falls such a big deal? These falls have the potential to become significant life changing events , especially if a fall results in a fracture. A history of fracture can increase the risk of subsequent fractures: Prior rib fracture can increase risk of vertebral body fractures by 2.3- fold Prior vertebral fracture can increase risk of subsequent vertebral fractures by 9.1-fold; new hip fracture by 7.1- fold; and wrist fracture by 2.3- fold Prior shoulder fracture can increase risk of new wrist fracture by 5-fold; new vertebral body fracture by 10-fold; and new hip fracture by 18-fold Prior wrist fracture can increase risk of vertebral body fracture by 37% The Center for Disease Control has estimated the rate of death from falls increased 30% from 2007 to 2016. If this rate continues to increase, there will be an estimated 7 deaths each hour related to falls. Falls can occur for many reasons, no matter your age. When younger people fall intact protective mechanisms may lead to a fall on an outstretched hand, resulting in a hand or wrist fracture. Older people have compromised protective mechanisms which may lead to a fall on their side, resulting in a hip fracture, or even a head injury. The CDC and National Council for Aging are excellent resources for learning about fall prevention. You can find a questionnaire to check your risk for falling here . While this information about falls may seem scary at first, it can empower you to talk to your health care provider about fall prevention. There are a number of simple in-office fall assessment tools available through your doctor or physical therapist. Ask about having your balance assessed. If your primary care doctor or orthopaedic surgeon are not able to assess you, ask for an assessment with a physical therapist. Here are some safety tips for you or for loved ones at home: Ask your loved one if they are concerned about falling. Be gentle and compassionate. God willing, we will all grow older, and most likely weaker. Notice if they are holding on to furniture or walls to move about the house, or have difficulty getting out of a chair. Discuss current health conditions. Have a list of current medications. Sometimes medications can make people dizzy, weak, or affect eyesight. Ask about their last eye exam and if they needed updated glasses. Do a home safety check. You can get a home safety checklist at the website listed above. Ask about fluid and food intake. Dehydration and low blood sugar can cause dizziness and lead to falls. Let’s not forget about pets. 66.4% of falls associated with cats and 31.3% of falls associated with dogs are from tripping over the animal Among people hospitalized for falls over pets, 79.9% were fractures 8.8% of pet-related injuries were caused by people tripping over a pet toy or food bowl Journal of Safety Research 2010 and WebMD 2010 Here are a few tips to consider: Walk the dog, don’t let the dog walk you Dog obedience training Clean food and water spills that can cause slip and falls Clear floors of pet toys and leashes Avoid bending over to pet an animal Crate your dog or put the dog outside when expecting company Be aware of your limitations and consider risk assessment before doing something you may consider stupid after sustaining an injury. If you have never tried ice-skating and you have decided that you want to try it as an older adult, you may consider doing a risk assessment. That assessment may go something like this: If I fall and break my wrist, will I be able to work and continue to earn money to pay my bills? If I broke my ankle, who will drive me around? For me, the answer is learning to ice-skate at my age is not worth the risk of a fracture. There are other activities I enjoy doing. Many patients have asked about skiing. If you have enjoyed skiing your entire life and you desire to continue this activity, do a risk assessment of the type of skiing you want to do. You may decide to stay away from black diamonds. You may decide you will be better off on green or blue slopes. You can still enjoy the activity as you age with some adjustments. At some point, you may decide that the activity no longer gives you the joy it did previously and you move on to something else. Situational awareness or mindfulness in the moment is key to fall prevention. Whenever a patient comes to me for treatment of a fracture, I ask about how the fracture occurred. Typically, the answer is related to a fall. I follow with, “How did you fall?”. A story unfolds. Many times the story involves doing too much at once, not paying attention, or not turning on a light at night and tripping on something. Slow down. Have a night light for those night-time trips to the bathroom. Avoid carrying 15 grocery bags into the house at one time. Carry 3-4 and make multiple trips. Being in the moment prevents falls. In summary, there are a number of reasons why a person may fall. Reasons may include medications or interactions of medications that cause dizziness; poor eyesight; muscular weakness, dehydration, low blood sugar, a cluttered home, lack of mindfulness, pets, and not knowing limitations. The CDC and the National Council on Aging are great resources to get started with assessing your risk or your loved one’s risk for falling. Each source provides tips for preventing falls. If you have experienced falls, please share that information with your doctor, physical therapist, or loved one. There is no shame in asking for help to prevent a fall. If you have a loved one who has fallen, please do not shame them. Treat them with the kindness and compassion you want for yourself. Respect their dignity. Preventing a fall is preventing a fracture.
September 3, 2024
Why Is My Doctor Trying to Scare the $h!t Out of Me?
August 23, 2024
Bone Health is Connected to Overall Health
July 17, 2024
Guest blog by Nick Birch, FRCS (Orth)
A doctor examines the back of a patient 's neck
June 21, 2024
I recently received a question: why is my T score going up and my fragility score getting worse? This is a great question. Let's take this step by step. First let's address the T-score. When tracking bone health over time, we must evaluate the actual numbers for Bone Mineral Density (BMD), not T-score. The T-score is a nice way to get an overall picture of your BMD compared to a 30-year-old white female. It is easy to get sucked into comparing T-scores, as we have all been conditioned to look at T-scores. However, T-scores represent standard deviations on a graph, and they represent a range of numbers and not absolute values of BMD. Therefore, tracking bone density over time can only be done by comparing BMD values in g/cm 2 and expressing those changes as percentages compared to baseline and compared to the result immediately prior. There are several factors that cause the BMD and therefore T-scores to change including age, levels of activity, nutrition and build. In post-menopausal women, there is a natural reduction of BMD and T scores over time which can be slowed, and in some cases reversed, with attention to good nutritional balance and lots of impact and resistance exercise. These changes usually occur slowly and are often not detectable on DXA scans in under several years because the Least Significant Change (LSC) is 5-6% which is not sensitive enough to measure a few percentage points difference. REMS can detect such changes, usually at yearly intervals. Changes in BMD caused by increases or decreases in weight and thus Body Mass Index (BMI) occur more quickly, and these changes can often be detected by REMS over a period of months rather than years. If the change is sufficiently large, DXA will be able to detect it in similar timeframes. For simplicity, let’s say BMD in 2022 was 0.983 g/cm 2 . Then in 2024, BMD was 0.899 g/cm 2 . The change in BMD is calculated as follows: 0.899 - 0.983 = -0.084 This demonstrates a decrease BMD (g/cm 2 ) over 2 years. To find the percent change, divide -0.084 by the original BMD (g/cm 2 ) -0.084 ÷ 0.983 = -0.085 This indicates there was an 8.5% decrease in BMD (g/cm 2 ). Remember to take into consideration the LSC which are different for DXA and REMS. A generally accepted LSC for DXA is 5-6% . So, if the change in BMD over time is less than 5-6%, it is not necessarily a real change when measure by DXA. If the change is greater than 5-6%, it does represent a real change. LSC for REMS is 0.88-1.05% (0.88% for hip and 1.05% for spine) meaning it can detect smaller changes, often in shorter timeframes. In the example provided above, there was a real change in BMD, as 8.5% is greater than 5-6% for DXA and 0.88-1.05% for REMS. Fragility Score is an adimensional number from 0-100. The lower the score, the better. FS reflects the micro-architecture of the bone. The AI in REMS technology compares the acquired spectra from the patient to a reference database. If the patient’s spectra match the spectra of individuals who have fractured, the patient will be in the RED. If the patient’s spectra match the spectra of individuals in the database who did not fracture, then the patient will be in the GREEN. YELLOW indicates some individuals fracture, and some did not. There is a natural increase in FS over time which is in the range of 1.5 – 2.0% per year in post-menopausal women. If the difference in FS over, for instance three years, is 4-5, that change may be inconsequential, considering the LSC and the expected change with age. Remember, you are more than your T-scores or Z-scores. Knowledge brings empowerment and peace of mind.
A woman is sitting on the floor looking at a piece of paper
June 12, 2024
It is VERY common to see discrepancies in the values noted on DXA versus values noted on REMS. Without seeing the images from your DXA scan on a complete report, your physician is not able to pick apart the details of your DXA report. However, there are some common themes that we REMS users have seen. For a simple guide to understanding your DXA report, please see: Choplin, et al. "A practical approach to interpretation of dual-energy x-ray absorptiometry of bone density," Curr Radiol Rep (2014). During the development of REMS technology, REMS was compared to the "gold standard" of DXA. The performance of the DXAs for comparison was quality controlled, as was the performance of the REMS. In the community, DXA quality is not assured the same way that it is in a research scenario. The potential for errors is high for DXA. The potential for REMS errors is much lower given the precision of the technology. For reference, please see: Messina, et al. "Prevalence and type of errors in dual-energy x-ray absorptiometry." Eur Rad, Nov 2014. Fatima, et al. "Discordant interpretation of serial bone mineral density measurements by dual-energy x-ray absorptiometry using vendor's and institutional least significant changes: Serious impact on decision-making," World Journal of Nuclear Medicine, 2018, 236-240. Typically, the values on DXA hips, REMS spine, and REMS hips are similar. The DXA spine is typically the outlier. DXA spine values may be very negative and DXA hips and REMS spine and hips are not so negative. Why would your spine be one value and your hips a completely different value on DXA? Dr. Nick Birch and his colleague Maddy Young presented their data regarding discordance at the British Orthopaedic Research Society annual meeting in the autumn of 2023. Young M, Birch N. “Prevalence of major and minor discordance between hip and spine T-score using REMS: Implication for bone health assessment and patient management.” Orthop Procs. 2023;105-B(SUPP_16):46-46. If you are interested in learning about the development of REMS technology, or to have a couple of papers to share with your treating physicians about REMS, I recommend: Della Ciardo, et al. "Pulse-Echo Measurements of Bone Tissue, Techniques and Clinical Results at the Spine and Femur," Bone Quantitative Ultrasound. Advances in Experimental Medicine and Biology 1364. Pisani, et al. "Screening and early diagnosis of osteoporosis through x-ray and ultrasound- based techniques," World Journal of Radiology, 2013 Nov 28; 5(11): 398-410. ​Pisani et al. "Fragility Score: a REMS-based indicator for the prediction of incident fragility fractures at 5 years," Aging Clin Exp Res; 2023; 35(4): 763-773. This last paper is ground-breaking as it demonstrates the importance of consideration of bone quality in terms of fracture risk. This paper is mentioned in the 10-minute video tutorial, “ Understanding Your REMS Report ”. Here are some things you may consider: Was there a significant change between your baseline DXA and subsequent DXAs? Is it reasonable to obtain serial scans over the next couple of years? If there is no change and your bone density and quality are stable, is there a need for medication for bone health? If there is a precipitous decline in density or quality, would you consider medication? Be honest with yourself and your treating physician about what you are willing to do or not do to optimize your bone health. Have you had a fragility fracture? Fractures are the greatest predictors of future fractures. Are your labs normal? Receiving the diagnosis of osteoporosis can be overwhelming. Remember, you are more than your DXA T-score or Z-score.
More Posts